 Development
What Is the Difference Between UI and UX? A Complete i2d Guide
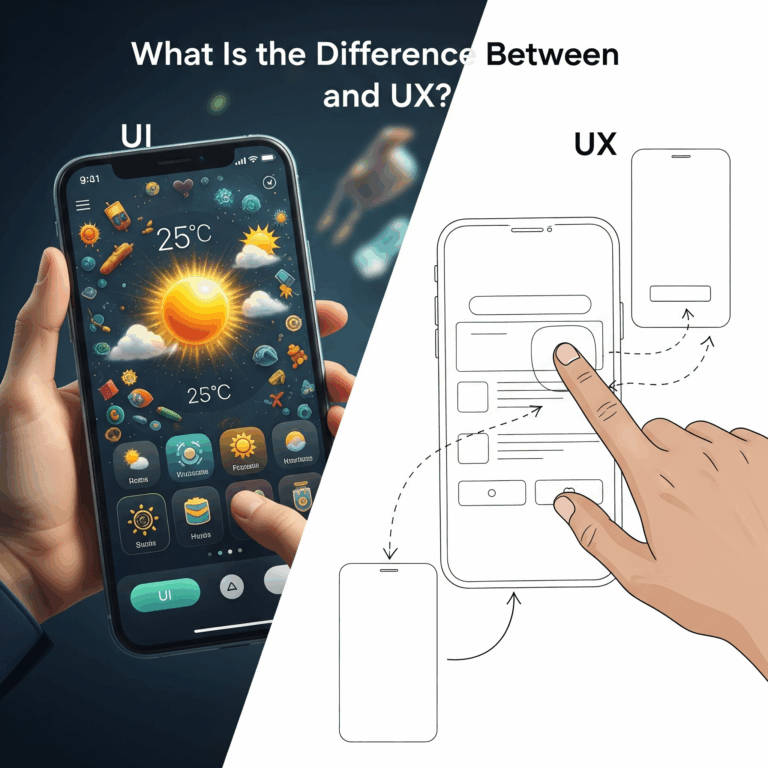
When browsing websites or using mobile apps, you’ve likely encountered the terms UI and UX. These buzzwords appear everywhere in the digital world, yet many...
Read MoreMost Auckland businesses pour thousands of dollars into Google Ads and SEO content — then watch their rankings plateau. The culprit? A slow website that...

Most Auckland businesses pour thousands of dollars into Google Ads and SEO content — then watch their rankings plateau. The culprit? A slow website that Google is quietly penalising. Here’s what Core Web Vitals are, why they matter more than ever for SEO Auckland, and exactly how to fix them.
In 2021, Google made a decision that permanently changed the SEO game in New Zealand: they made website performance a direct ranking factor. Fast forward to 2025, and Core Web Vitals remain one of the most misunderstood — and most neglected — elements of SEO Auckland strategy. We regularly audit Auckland business websites scoring 40–60 on mobile PageSpeed, quietly haemorrhaging search visibility while their competitors race ahead.
Core Web Vitals are a set of three specific performance metrics Google uses to measure the real-world experience of users visiting your website. They aren’t just abstract numbers — they reflect how fast your page loads, how quickly it responds to interaction, and how visually stable it is as it loads.
Think of them as your website’s report card from the perspective of someone sitting in Grey Lynn on their mobile, on a 4G connection, trying to find a plumber at 8am. Does your page serve them well? Google increasingly rewards those that do — and penalises those that don’t.
Together, these three metrics form the backbone of Google’s Page Experience signals. In the highly competitive Auckland digital market, where dozens of agencies and local businesses are all vying for the same top-3 positions, Core Web Vitals can genuinely be the difference between ranking on page 1 or page 3.
| LCP | INP | CLS |
| Largest Contentful Paint How fast does your page’s largest visible element load? Usually your hero image or headline. | Interaction to Next Paint How quickly does your page respond after a user clicks a button or taps a menu? | Cumulative Layout Shift Does your page jump around as it loads, causing users to accidentally click the wrong thing? |
| Good: under 2.5s | Good: under 200ms | Good: under 0.1 |
Together, these three metrics form the backbone of Google’s Page Experience signals. In the highly competitive Auckland digital market, where dozens of agencies and local businesses are all vying for the same top-3 positions, Core Web Vitals can genuinely be the difference between ranking on page 1 or page 3.
Here’s what most agencies won’t tell you: Google doesn’t publicly disclose exactly how much weight Core Web Vitals carry in its ranking algorithm. But the evidence from real-world SEO data — and from our own client work across Auckland — is clear and consistent.
When we rebuilt the i2design website on WordPress and PageSpeed dropped from 95 to 67 on mobile, we saw it firsthand. Performance isn’t a “nice to have” — it’s a ranking signal Google takes seriously. We fixed it. Your site can too.
The Indirect Effects Are Equally Damaging
Beyond the direct ranking signal, poor Core Web Vitals create a cascade of SEO-destroying behaviours. When your page is slow, users bounce. High bounce rates signal to Google that your page didn’t satisfy the search intent. When elements jump around (high CLS), users lose trust and leave immediately. When interactions feel laggy (poor INP), users abandon forms and calls-to-action.
All of these behavioural signals feed back into Google’s understanding of your page quality. A technically beautiful page with keyword-optimised content can still underperform in Auckland search results if the user experience is poor.
Research shows that a 1-second delay in page load time can reduce conversions by up to 7%. For an Auckland business generating $50,000/month in website revenue, that’s potentially $3,500 per second of load time lost — every single month.
Before fixing anything, you need to know where you stand. Here are the three tools we use at i2design for every client website audit in Auckland:
Head to pagespeed.web.dev and enter your URL. This gives you both mobile and desktop scores, plus a detailed breakdown of exactly which issues are dragging your performance down. Always test mobile first — that’s where most Auckland users are browsing from.
If you have Google Search Console set up (and you absolutely should), navigate to Experience → Core Web Vitals. This shows you real-world data from actual users visiting your site — not just a lab simulation. It’s the data Google actually uses in its ranking calculations.
Open Chrome, right-click any page, hit Inspect, then navigate to the Lighthouse tab. Run an audit to get a comprehensive performance report. This is particularly useful during development to catch issues before going live.
Always run PageSpeed tests in incognito mode to ensure browser extensions aren’t skewing your results. Also test at different times of day — your hosting server’s performance can vary, especially if you’re on shared hosting.
Google categorises Core Web Vital scores into three bands. Here’s the full breakdown so you know exactly what you’re aiming for:
| Metric | 🟢 Good | 🟡 Needs Improvement | 🔴 Poor |
|---|---|---|---|
| LCP (Load Speed) | Under 2.5s | 2.5s – 4.0s | Over 4.0s |
| INP (Responsiveness) | Under 200ms | 200ms – 500ms | Over 500ms |
| CLS (Visual Stability) | Under 0.1 | 0.1 – 0.25 | Over 0.25 |
We recommend aiming for all three metrics in the “Good” band. Achieving two out of three is common but still leaves a ranking gap that competitors with clean scores will exploit over time.
After auditing hundreds of Auckland business websites, we see the same culprits over and over again. If your site is underperforming, there’s a very high chance one of these is the cause:
This is the single biggest LCP killer we encounter. When your browser has to download and parse large CSS or JavaScript files before it can paint any content, your users stare at a blank white screen. The fix involves deferring non-critical JavaScript, inlining critical CSS, and removing unused stylesheet code. On a typical Auckland WordPress site, this alone can improve LCP by 1–2 seconds.
Your gorgeous hero image might be 3MB of JPEG at full resolution. To your Auckland customer loading on a smartphone in traffic, that’s 3–5 extra seconds of loading a white screen. Converting images to WebP or AVIF format, compressing them properly, and adding explicit width and height attributes (which also fixes CLS) are non-negotiable steps.
Without proper server-side and browser caching, every single visitor to your Auckland website triggers a fresh database query and PHP rendering process. Quality hosting with Nginx full-page caching (like WP Engine, which we use) can reduce server response times from 800ms to under 100ms.
Every WordPress plugin you install adds code that loads on every page — often whether it’s needed or not. Contact Form 7 loading on your homepage? That’s unnecessary JavaScript. Sliders, social sharing widgets, and live chat plugins are particularly notorious for bloating page load time and wrecking INP scores.
defer attributefont-display: swapCustom web fonts are beautiful but they’re a performance minefield. Loading Google Fonts without font-display: swap, hosting fonts on external servers, or loading multiple font weights you don’t use — all of these cause LCP delays and visible layout shifts as fonts render.
Auckland has one of the most competitive local search markets in New Zealand. Whether you’re targeting “plumber Auckland”, “accountant Newmarket” or “website design Auckland”, the businesses you’re competing against are increasingly well-optimised — and many of them have already fixed their performance issues.
When all other ranking factors are relatively equal — similar domain authority, similar content quality, similar backlink profiles — Core Web Vitals become a meaningful differentiator. We have seen clients jump from position 6–8 to position 2–3 for key Auckland search terms purely off the back of performance improvements.
There’s also the mobile dimension. Auckland has extremely high smartphone usage, and a significant portion of searches happen on mobile networks that can be unreliable. A site that scores 90+ on desktop but 55 on mobile is effectively invisible to a huge slice of its potential Auckland audience.
Combining a clean Google Business Profile with a fast, well-structured website creates a compounding effect in Auckland local search. Google rewards businesses that provide a consistently great experience across both organic and map pack results.
This is the question every Auckland business owner wants answered. The honest answer: it depends on how frequently Google re-crawls your site, but in our experience, most sites see measurable ranking movements within 4–8 weeks of meaningful performance improvements.
Google’s crawl frequency is tied to your domain’s authority and how often your content changes. A well-established Auckland business with regular blog content and decent backlinks will typically see faster re-evaluation than a newer site. The key is ensuring Google sees the improved performance data — which comes from both Googlebot crawling your pages and real-user data accumulating in Chrome.
One important nuance: Core Web Vitals are evaluated at the URL level, not just the domain level. Fixing your homepage but leaving service pages slow means those individual pages still carry the performance penalty. A comprehensive audit should cover your highest-traffic pages, not just the homepage.
At i2design, we treat Core Web Vitals as a foundational part of every website we build or optimise. Our approach isn’t to bolt performance on afterwards — it’s to architect it in from the start.
Every website we build uses a critical CSS extraction strategy, ensuring the browser can paint the above-the-fold content instantly without waiting for full stylesheet downloads. We implement aggressive image optimisation pipelines, use WP Engine’s enterprise-grade caching infrastructure, and conduct conditional plugin loading so Contact Form 7 only loads on contact pages, not your homepage or service pages.
The result? Our websites consistently score 90+ on both mobile and desktop in Google PageSpeed Insights — while still being visually rich, animation-driven, and conversion-optimised. Fast and beautiful aren’t mutually exclusive. You just need to know what you’re doing.
DevelopmentWhen browsing websites or using mobile apps, you’ve likely encountered the terms UI and UX. These buzzwords appear everywhere in the digital world, yet many...
Read More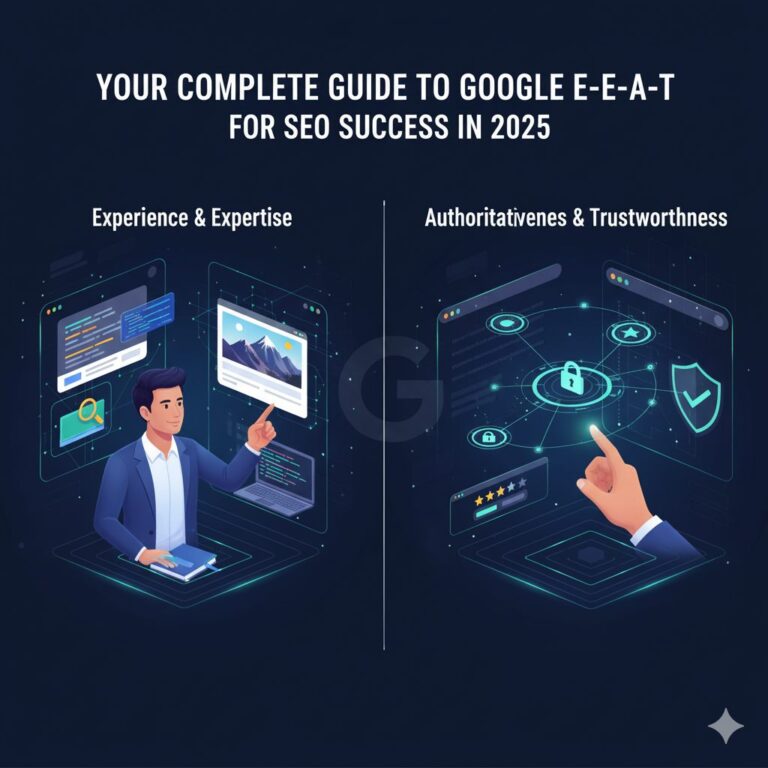 SEO
SEOGoogle’s search algorithms are always changing, so anyone who wants to do SEO well needs to know what E-E-A-T means. This new framework adds Experience...
Read More SEO
SEOYour online presence can be made or broken by the right SEO Auckland agency. There are hundreds of agencies that say they are the best....
Read More